Latest News
The B.C. Centre for Disease Control has released more specific information about COVID-19 by neighbourhood.
Photo screen grabs from B.C. Centre for Disease Control
The B.C. Centre for Disease Control has released more specific information about COVID-19 by neighbourhood.
Photo screen grabs from B.C. Centre for Disease Control
The B.C. Centre for Disease Control has released more specific information about COVID-19 by neighbourhood.
Photo screen grabs from B.C. Centre for Disease Control
New data maps show Richmond-specific COVID-19 information

By Hannah Scott, Local Journalism Initiative reporter
Published 11:29 PDT, Fri May 14, 2021


—
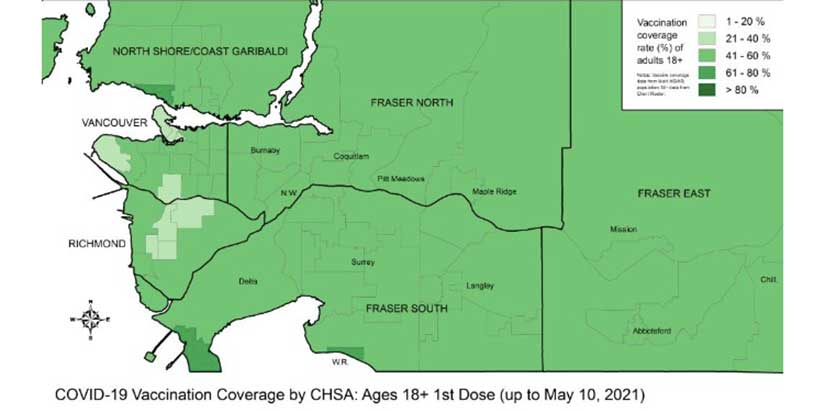
New data released by the B.C. Centre for Disease Control this week shows COVID-19 vaccination rates, average daily cases and test positivity in specific neighbourhoods, including Richmond.
The maps break the city into seven regions. Up to 80 per cent of Richmondites aged 55-plus have been vaccinated in six of the seven neighbourhoods. In Steveston, the vaccination rate is higher—over 80 per cent. This is comparable to the average across the province and in the Greater Vancouver area.
Among all adult Richmondites (age 18-plus), the numbers are lower. While most of the Greater Vancouver area is within the 41 to 60 per cent range for vaccinations, four of Richmond’s mapped regions are in the 21 to 40 per cent range. The areas in the west, south and east are in the 41 to 60 per cent range. Province-wide, the vaccination rate for all adults varies from the 21 to 40 per cent range to the 61 to 80 per cent range in most places. Most of the Greater Vancouver area is in the 41 to 60 per cent range.
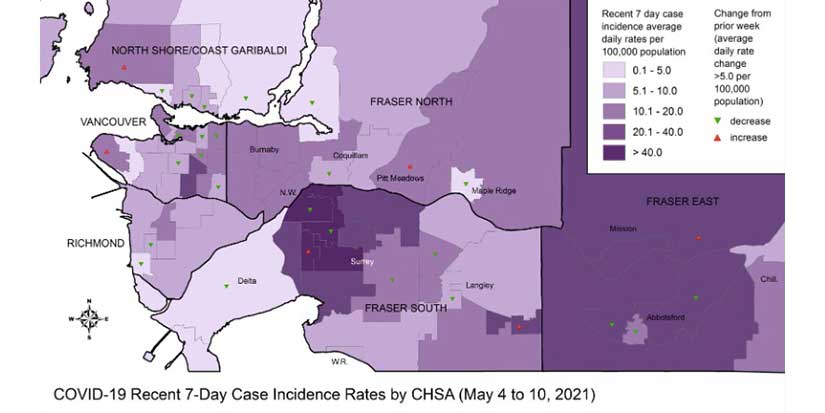
A second set of maps tracks the average daily cases between May 4 and 10, per 100,000 population. Most of Richmond has 5.1 to 10 new daily cases per 100,000, but there are a few outliers: the city centre region has 10.1 to 20 and the Steveston area less than five.
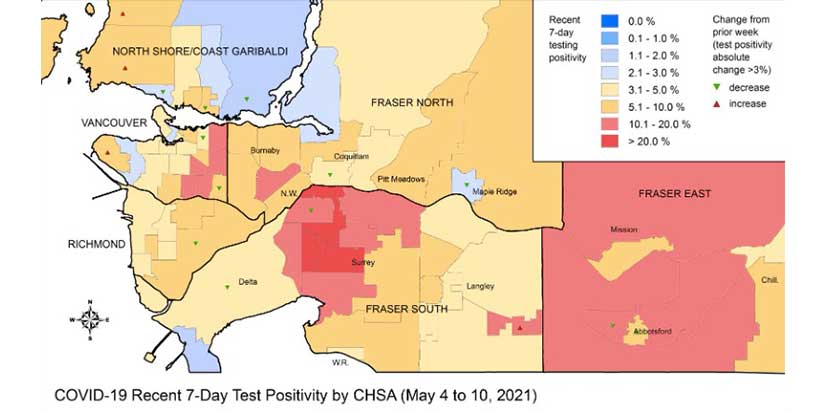
A third set of maps shows that test positivity is relatively consistent across Richmond, with 3.1 to five per cent of tests coming back positive in much of the west part of the city and 5.1 to 10 per cent further east.
The B.C. Centre for Disease Control website indicates that new geographic data will be provided weekly to update these numbers. A full report is available online.


2 Hours of free financial consulting
Jai Xin Planning Ltd.
C$120.00 C$0.00

Use any of our home staging service and get a second month rental for free!
MiiX Interiors
C$500.00 C$0.00

Get 10% off any order
Phantom Screens Lower Mainland
C$200.00 C$180.00